
Figure 3. Modulation of synaptic neuronal activity by stimulation of an adjacent Bergmann glial cell.
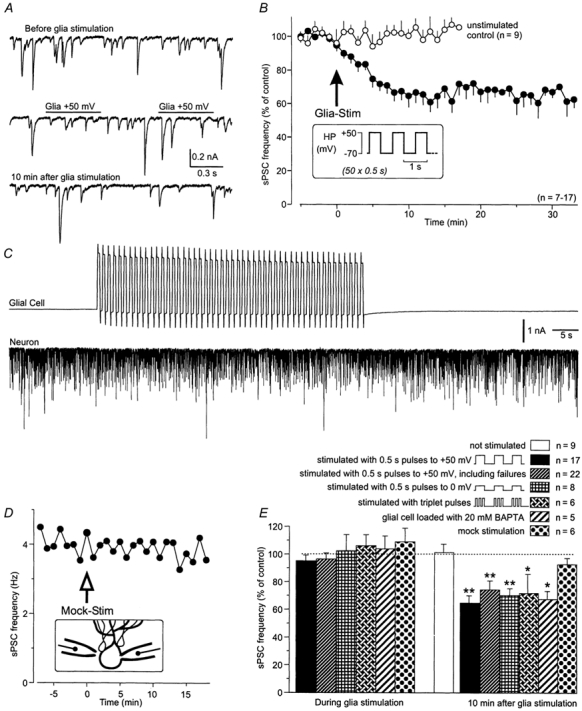
A, continuous recordings of sPSCs in a Purkinje neuron before, during and after stimulation of a neighbouring Bergmann glia. B, modulation of the sPSC frequency of Purkinje neurons (•) following a series of depolarizations of adjacent Bergmann glia (50 voltage steps from −70 to +50 mV for 0.5 s, at 1 Hz; see inset). The sPSC frequency (the mean frequency of 5 min control period = 100 %) decreased within 10 min after glial stimulation and remained at the reduced level for more than 30 min. In control experiments without glial cell stimulation the sPSC frequency remained unchanged (n = 9; ○). C, continuous recording of glial and neuronal membrane currents during a glial stimulation period. D, using the same protocol with the patch pipette close to a Purkinje cell soma (‘mock stimulation’; see inset) the sPSC frequency was not affected. E, histogram showing the changes in sPSC frequency under different experimental conditions: no glia stimulation; glia stimulated with 0.5 s pulses to +50 mV (standard) and to 0 mV; and including the 5 paired recordings in which no effect was observed after glia stimulation (‘failures’); glia stimulated with triplet pulses to +50 mV; glial Ca2+ transients suppressed by loading with 20 mm BAPTA; and mock stimulation. The mean sPSC frequency over a period of 5 min before glial stimulation was used as the control value for each condition. Asterisks indicate significant difference from the unstimulated control.