
Figure 1. Effects of FFA on post-train DAPs.
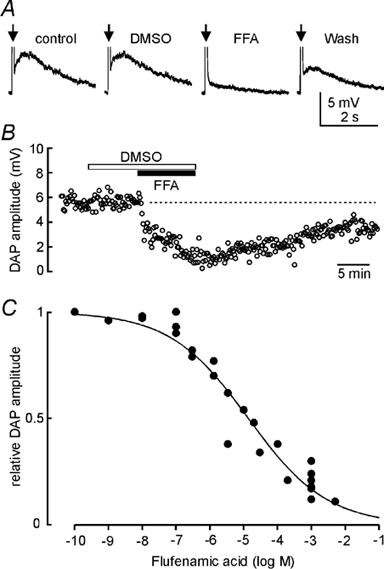
A, voltage recordings from an MNC. Individual traces show average (6 trials each) DAPs evoked by spike trains comprising 5 action potentials each (arrows; spikes not shown), evoked by a depolarizing current pulse. Vehicle (0.1 % DMSO) alone had no significant effect but application of 100 μm flufenamic acid (FFA) potently inhibited DAP amplitude. Note that 100 nm apamin was present throughout to inhibit the AHP. B, time course of the effects of 0.1 % DMSO and 200 μm FFA on another cell. Each point represents the amplitude of the DAP measured in an individual trial. Note the slow recovery of DAP amplitude following washout. C, effects of different concentrations of FFA on DAP amplitude. DAP amplitude was measured every 30-120 s from the average of 2-4 consecutive trials. Each point on the graph shows the maximal reduction of DAP amplitude observed in one cell at the corresponding FFA concentration. The continuous line is the best logistic fit through the data points computed using Sigmaplot 5.0 software (SPSS Science).