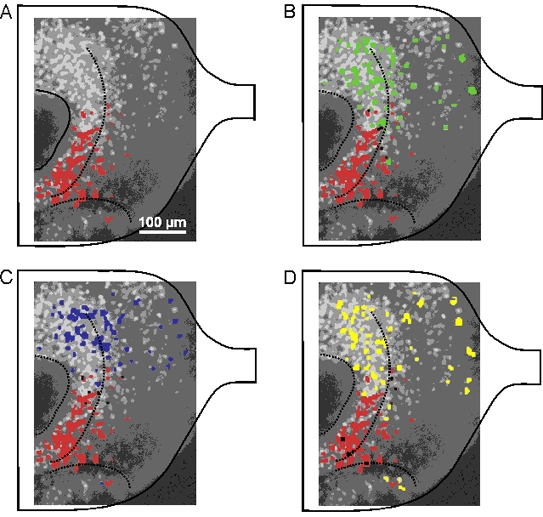
Figure 7. Comparison of [Ca2+]i responses in olfactory bulb neurons upon stimulation of the olfactory mucosa with amino acids, forskolin, IBMX and pCPT-cAMP.

Background in A-D is as in the preceding figure. A, [Ca2+]i activation pattern in response to the mixture of amino acids (100 μm, shown in red) superimposed on the background image. B-D, [Ca2+]i activation patterns in response to forskolin (50 μm, B, green), IBMX (500 μm, C, blue) and pCPT-cAMP (2.5 mm, D, yellow) were superimposed on the image shown in A. The areas of overlap are shown in black.
