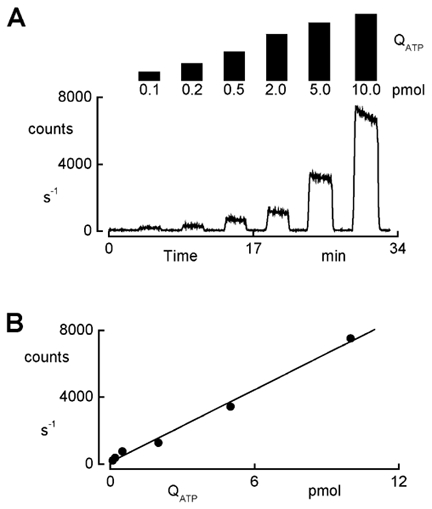
Figure 2. Calibration of the ATP measurements.

Calibration was performed using the experimental setup depicted in Fig. 1. The luminescence that originated from the standard solution in the basolateral compartment was recorded with a cell free culture cup. The LL reagent was added to the ATP containing solutions at 50 μl ml−1. A, time course of the luminescence signal recorded with hyposmotic solutions (140 mosmol (kg H2O)−1). The basolateral bath was continuously perfused and flow was interrupted after 5 ml of an LL reagent-containing solution had passed the chamber. During the indicated periods, the increase in luminescence expressed as counts per second was recorded with different amounts of ATP (QATP) ranging from 0.1 to 10 pmol, corresponding to concentrations between 0.1 and 10 nm. B, linear regression of luminescence (photon counts) versus ATP amount (QATP) of the experiment depicted in A.
