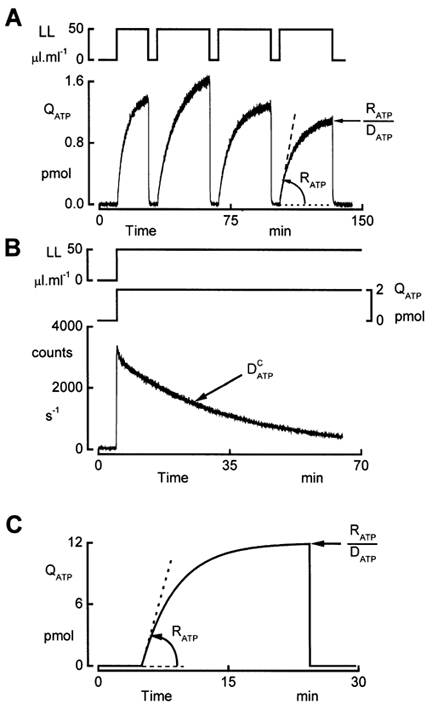
Figure 3. ATP accumulation in the basolateral compartment during hypotonicity.

A, recording of ATP accumulation. Initially, the epithelium was exposed to isosmotic solutions (260 mosmol (kg H2O)−1) and osmolality was reduced to 140 mosmol (kg H2O)−1 by removal of NaCl. ATP accumulation was recorded during hypotonicity after addition of the LL reagent and interruption of the perfusion. The first recording was initiated 20 min after imposing the hyposmotic challenge. Accumulation of ATP was monitored for 20 and 30 min periods during the first and subsequent LL exposures, respectively. The rate of ATP release (RATP) was determined as the slope of the initial rise in ATP content (QATP) in the chamber compartment. The rate constant of disappearance (DATP) was calculated by fitting an exponential function (eqn (4)) to the data. Mean values of RATP and DATP are listed in Table 2. B, consumption of ATP. The rate constant of ATP consumption () was determined in cell-free experiments using a Lucite cup to seal the basolateral compartment. Introducing a hyposmotic salt solution containing 2 pmol ATP and the LL reagent in the basolateral compartment rapidly increased luminescence. Subsequently the signal followed an exponential decay. The mean value of the time constant determined from five experiments was 58.0 ± 1.1 min−1. C, model calculations of ATP accumulation based on eqn (4) with RATP + 3 pmol min−1 and DATP + 0.25 min−1. RATP is the slope of the rise in QATP, and the plateau level represents the ratio between RATP and DATP.
