
Figure 2. sPSCs from a layer II pyramidal neurone.
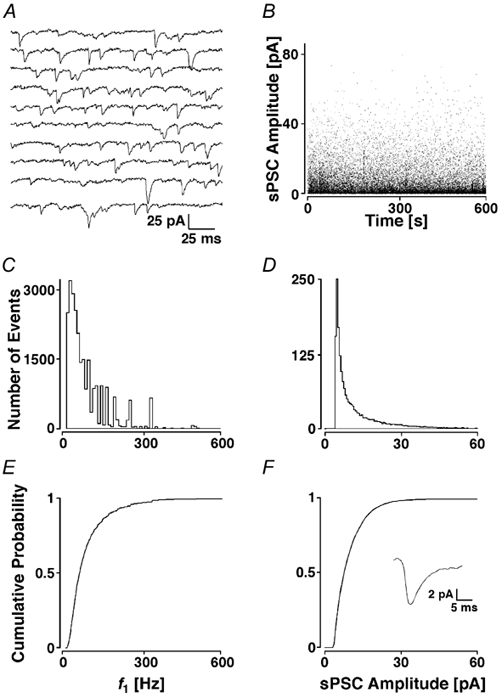
A, recording epoch of 2 s. B, individual sPSC amplitudes plotted against the time during the recording. Note the stationarity of the process. C, histogram of f1 sorted into bins of 10 Hz and D, peak amplitudes assigned to bins of 0.5 pA. E and F, cPDFs of the histograms shown in C and D with the average sPSC time course from the first 100 events illustrated in the inset.