
Figure 3. sPSCs in neocortex and hippocampus.
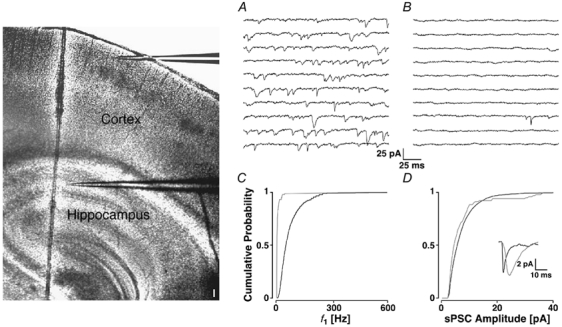
Two positions are illustrated by the placement of the recording electrodes in the photomontage of two IR-DIC images of a parasagittal slice. Barrels can be identified in somatosensory cortex (darker spots) and the cell layers in hippocampus (scale bar 100 μm). The sequences of the recording from a pyramidal cell in layer II of somatosensory cortex (A) and CA1 of hippocampus (B). The cPDFs of f1 (C) and amplitudes (D) for the neocortical (black line) and hippocampal neurone (grey line). The average sPSC time courses are illustrated in the inset.