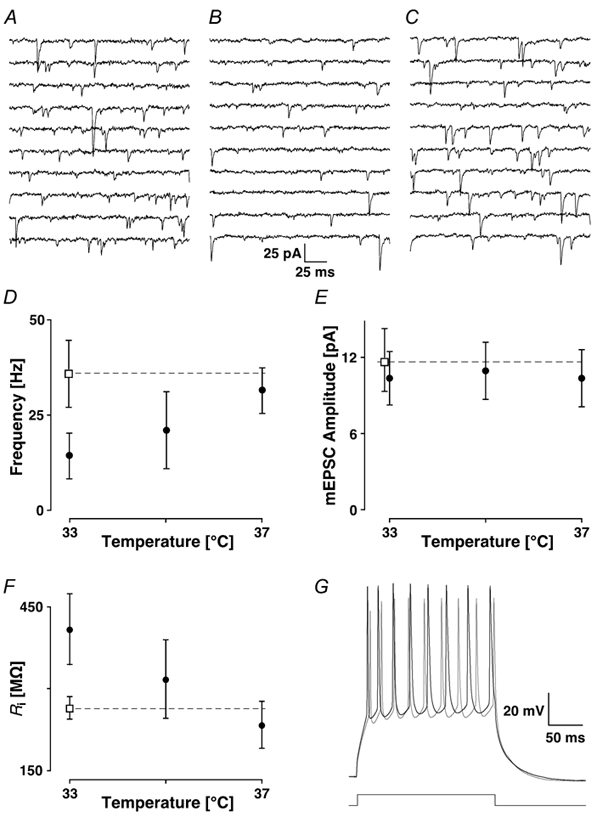
Figure 6. Temperature sensitivity.

Recording sequences are shown in A at 33 °C with the IR light on, in B at the same temperature but with the microscope lamp turned off and in C at 37 °C without light. The average mEPSC frequencies (D) and amplitudes (E) are plotted as a function of recording temperature without light (•) and with light on (□). The dashed line helps to extrapolate the higher frequency to the higher temperature. Note that the mEPSC amplitude has little dependence on temperature. In F, the input resistance is plotted as a function of temperature with the same symbol code as in the two previous figures. G, bursts of action potentials caused by current injection of 0.3 nA are illustrated at 33 °C without (black line) and with the light switched on (grey line).
