
Figure 8. Schematic diagrams of the reflex loop model.
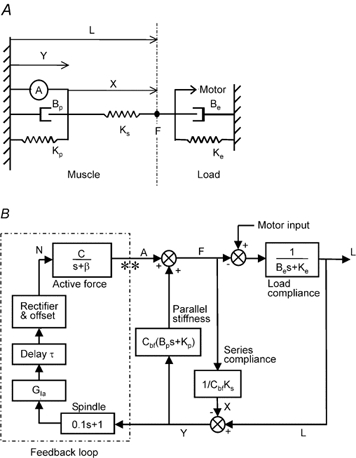
A, schematic representation of the Hill-type muscle model used to simulate the experimental data. B, detailed block diagram of the muscle, load and muscle spindle showing the feedback loop and where the loop was cut open (indicated by **) to estimate the open-loop gain. See Appendix for details.