
Figure 8. Effect of TTX on the resonance at different membrane potentials.
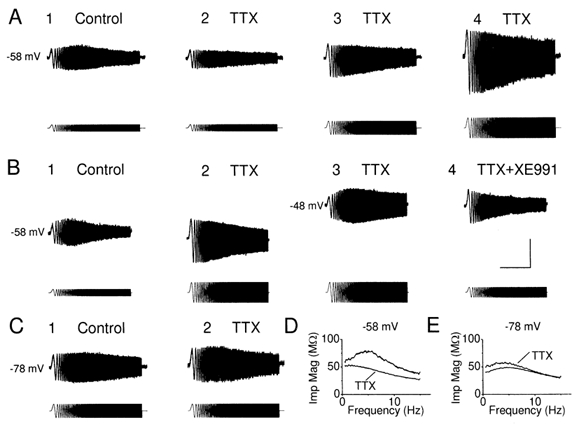
A, voltage responses to ZAP current before (A1) and after (A2-4), in a cell maintained at subthreshold level. The resonance at depolarized membrane potential was largely reduced by TTX at this membrane potential (n = 5, P = 0.03, Q = 1.17 ± 0.06 and 1.00 ± 0.00 before and after application of TTX). The peak-to-peak amplitude of voltage deflections in response to same ZAP current injection was reduced after TTX (A2), when compared to the control period (A1), due to the ‘amplifying’ effect of INaP. A3, resonance was absent after increasing the peak-to-peak amplitude of ZAP current, so that the peak-to-peak amplitude to voltage deflection was comparable before and after TTX. Resonance was not rescued by increasing the peak-to-peak amplitude of ZAP current to make the voltage response (A4) much larger than control. B1-3, in the presence of TTX, resonance was restored by depolarizing the cell further to -48 mV, whereas it was blocked by XE991 (B4, n = 4). C, voltage response to ZAP current injection from a hyperpolarized membrane potential before (C1) and after TTX (C2), in the same cell shown in A. Note that the resonance at -78 mV was resistant to TTX (n = 5, P = 0.22, Q = 1.17 ± 0.04 and 1.14 ± 0.04 before and after application of TTX). D, impedance magnitude plotted against input frequency, from the traces in A1 and A2. Note that distinct ‘hump’ of impedance magnitude profile close to 5 Hz in control condition disappeared in the presence of TTX. E, impedance magnitude plotted against input frequency, from the traces in C1 and C2. The small increase of the impedance magnitude could be due to rundown of the ‘leak’ current. The scale bars in B4 apply to all records in A-C: 10 s, 10 mV, 420 pA.