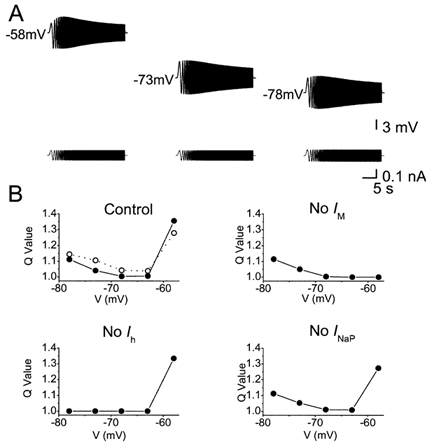
Figure 11. Computer simulation showing U-shaped voltage dependence of the resonance strength.

A, model simulations (with the same model as in Figs 9-10) of ZAP responses at three different membrane potentials: depolarized (-58 mV), resting potential (-73 mV), and hyperpolarized (-78 mV). B, plots of voltage dependence of resonance strength in the model. Comparison between results with the full model (Control) and with each of the three key ionic currents omitted from the model (No IM, No Ih, No INaP). In each case, the Q value, which indicates strength of resonance, was plotted as a function of the membrane potential (filled circles). In the upper left panel (Control), the experimental data, replotted from Fig. 3C, are shown for comparison (open circles and broken line).
