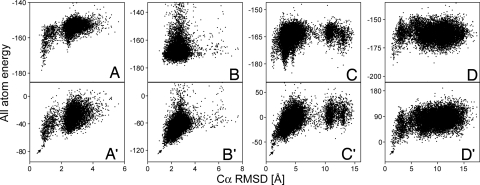
Fig. 2.
Plots of ROSETTA all atom energy versus Cα rmsd relative to the experimental structures for four representative test proteins. (A–D) Standard ROSETTA all atom energy. (A′–D′) ROSETTA energy, rescored by using the experimental chemical shifts (Eq. 1). (A) Ubiquitin. (B) Calbindin. (C) HPr. (D) TM1112. For A′–D′, the model with the lowest energy, marked by an arrow, is shown in Fig. 3 or SI Fig. 9.

