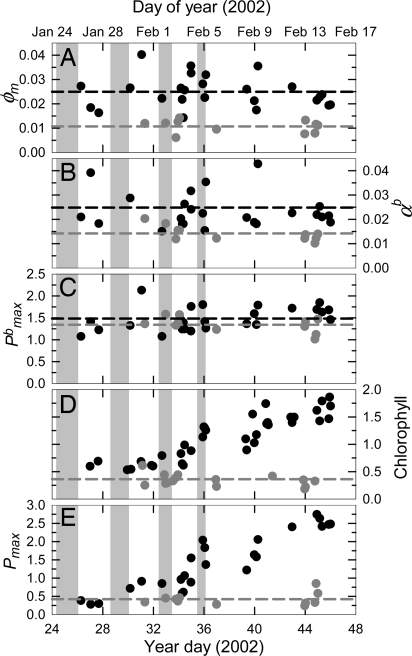
Fig. 1.
Time series of phytoplankton physiological parameters [φm, maximum quantum yield (A); α b, maximum Chl-specific light utilization coefficient (B); P maxb, Chl-specific maximum primary productivity (C)], biomass [HPLC-derived Chl (D)], and primary productivity [Pmax, maximum primary productivity (E)]. Black circles and black dotted lines represent discrete samples and the mean value inside the iron-enriched patch, respectively. Dark gray circles and dark gray dotted lines represent discrete samples and mean values outside the iron-enriched patch, respectively. Gray bars indicate periods of iron fertilization. Physiological units are as in Table 1: Pmax (mgC · m−3 · h−1), chlorophyll (mg m−3).

