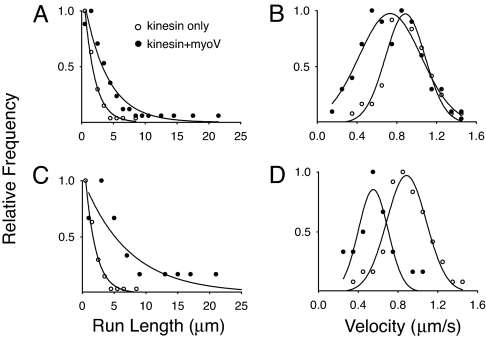
Fig. 2.
Run length (A and C) and velocity (B and D) distributions on microtubules. (A and B) Data obtained when Qdots were incubated with both kinesin and myoV (filled circles), or with kinesin alone (open circles). (C and D) Analysis of the subpopulation of runs (22% of total) that included obvious diffusive events or pauses. The run length and velocity of the entire run (filled circles), are compared with the run length and velocity of kinesin alone (open circles, as in A and B). The relative frequencies were determined by using the total number of runs for a given experimental condition as reported in Table 1.

