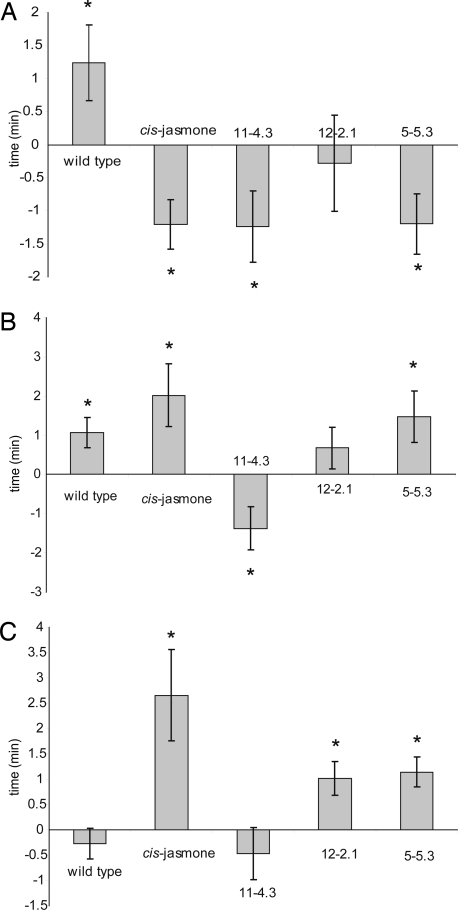
Fig. 1.
Olfactometer responses of M. persicae (A), L. erysimi (B), and A. ervi (C). Corrected responses are shown (mean time spent in the control arms was subtracted from time spent in the treated arm for each replicate). Asterisks indicate where time spent in the treated arm was significantly different from time spent in the control arm (P < 0.05).

