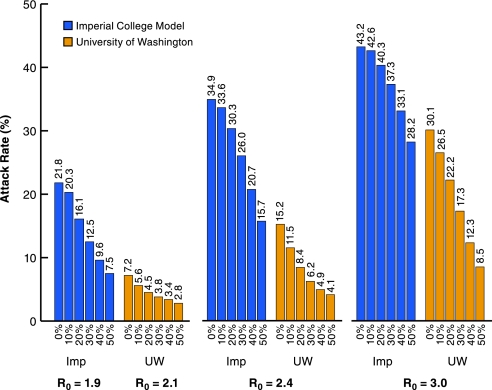
Fig. 2.
Sensitivity analysis for workplace and community social distancing. Scenario 2, with community and workplace social distancing being varied between 0% and 50%, and three R0 values (Chicago population). Only the UW/LANL and Imperial/Pitt models were used. The VBI model is insensitive to changes in this aspect of community social distancing.

