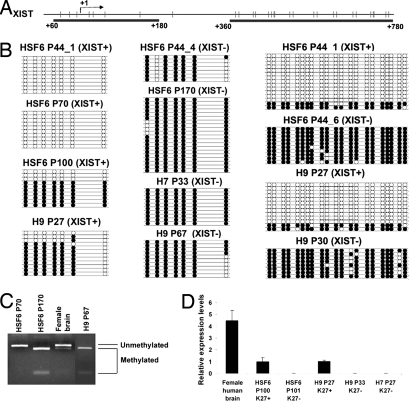
Fig. 2.
DNA methyation analysis of the XIST promoter and real-time RT-PCR analysis of XIST RNA levels. (A) Schematic diagram of XIST promoter/first exon and a further downstream region analyzed. CpG sites are presented in vertical bars, and the arrow indicates the transcription initiation site of XIST. CpG sites analyzed are underlined by black bars. (B) Bisulfite sequencing analysis reveals methylation patterns of promoter/first exon and a further downstream region of XIST gene in XIST+ and XIST− H9 and HSF6 hESCs and XIST− H7 hESCs in various passages. Each filled black dot represents one methylated CpG site, and an open dot represents an unmethylated CpG. (C) COBRA assay showing the XIST promoter for XIST− H9 and HSF6 are fully methylated, whereas the XIST promoter of XIST+ HSF6 is hypomethylated compared with normal female brain DNA. (D) Real-time quantitative PCR showing relative XIST expression levels in various samples of HSF6, H9, and H7 hESCs.

