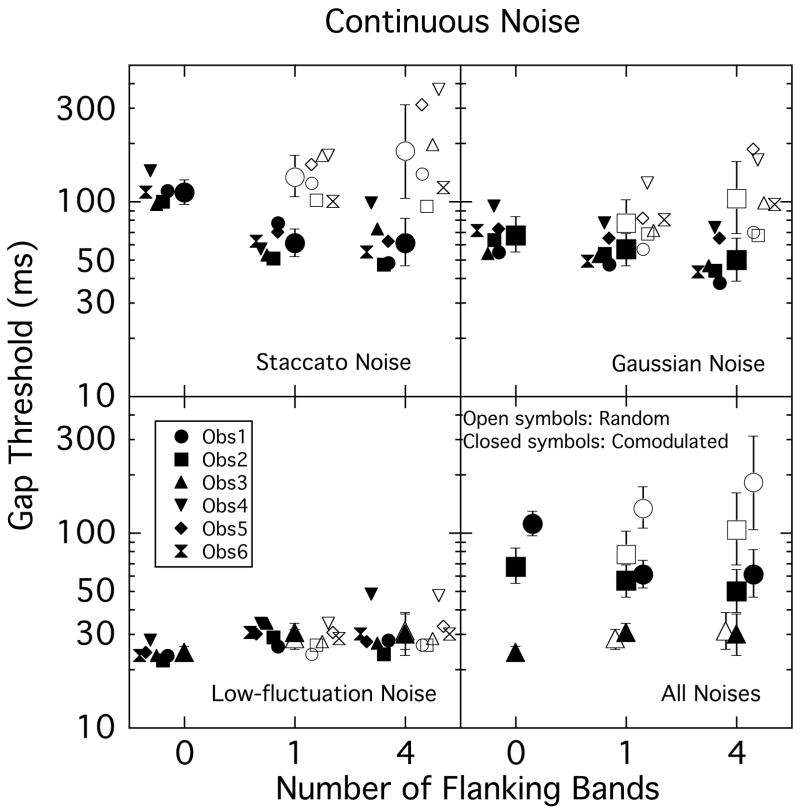
Fig. 2.
Gap detection thresholds as a function of the number of flanking bands for continuous stimulus presentation. Data are shown in separate panels for each type of noise (SN, GN and LFN), with the group means overlaid in the lower right panel (circles: SN, squares: GN, triangles, LFN). In each panel group means are shown by large symbols, ± 1 standard deviation, with filled symbols indicating comodulated conditions and open symbols indicating random conditions. Individual data points are shown clustered to the side of the respective mean in each panel.

