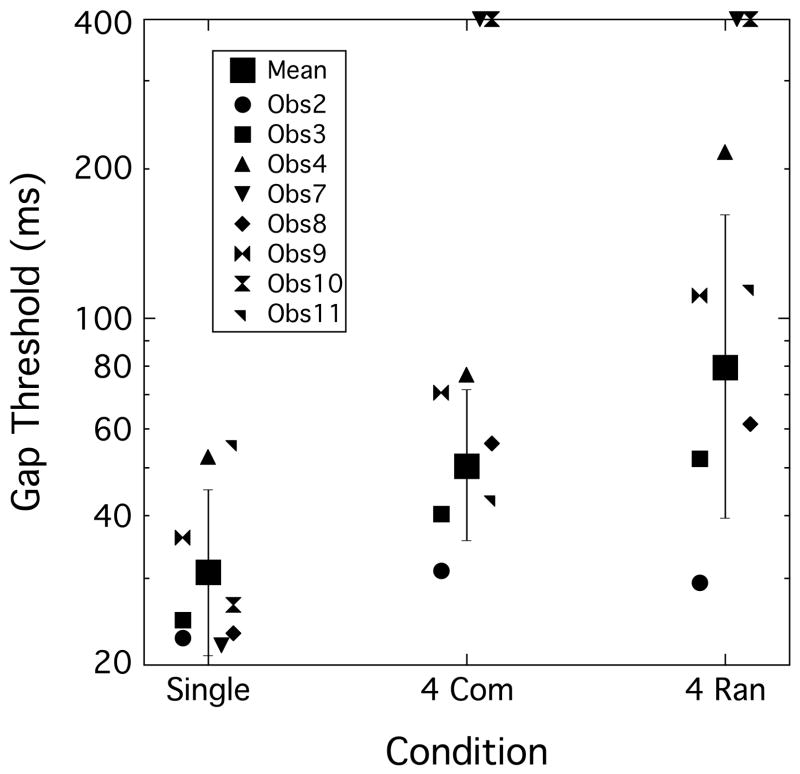
Fig. 6.
Gap detection thresholds as a function of the presence and type of flanking bands: Single – no flanking bands present; 4 Com – four comodulated flanking bands; 4 Ran – four random flanking bands. Group means are shown by large squares, ± 1 standard deviation, with individual data points clustered around the respective mean. Symbols on the top edge of the graph indicate ceiling performance at 400 ms.

