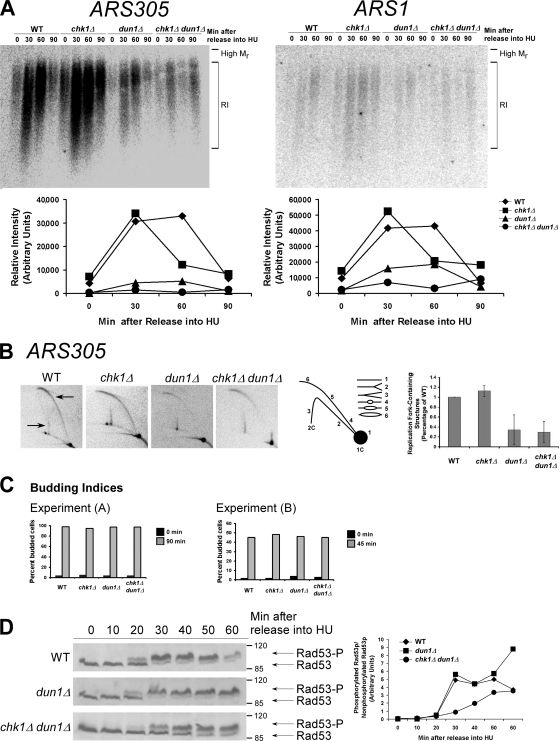
Figure 1.
The number of stalled chromosomal replication forks early in S phase is reduced in dun1Δ and chk1Δ dun1Δ cells in response to HU and correlates with a defect in S-phase checkpoint activation. (A, top) Cells were released from G1 into medium containing 200 mM HU. Chromosomal DNA was subjected to alkaline gel electrophoresis. RIs were monitored by Southern blot analysis using a probe for the indicated replication origin. (A, bottom) Relative intensity of RI signal normalized to the amount of DNA loaded. Seven independent experiments showed similar trends and one typical experiment is shown for each ARS. (B) Cells were treated as in A. (B, left) Southern blot analysis of chromosomal DNA prepared 45 min after release into HU and subjected to 2D gel electrophoresis was performed using a probe for ARS305. Arrows designate signal that represents replication fork–containing structures. (B, middle) Illustration of restriction fragment structures and the corresponding Southern blot patterns. (B, right) Mean ratio of signal for replication fork–containing structures to linear DNA as a percentage of the wild-type (WT) ratio for three experiments. Error bars represent one standard deviation from the mean. (C) Budding index. 100 cells from A and B were scored for buds. Additional data that support this trend were observed in other replicates (Tables S2 and S3, available at http://www.jcb.org/cgi/content/full/jcb.200706009/DC1). (D, left) Cells were released from G1 into medium containing 200 mM HU. Rad53p phosphorylation was monitored by Western analysis. The Molecular masses (in kilodaltons) are indicated to the right of each panel. (D, right) The ratio of phosphorylated to unphosphorylated Rad53p signal.

