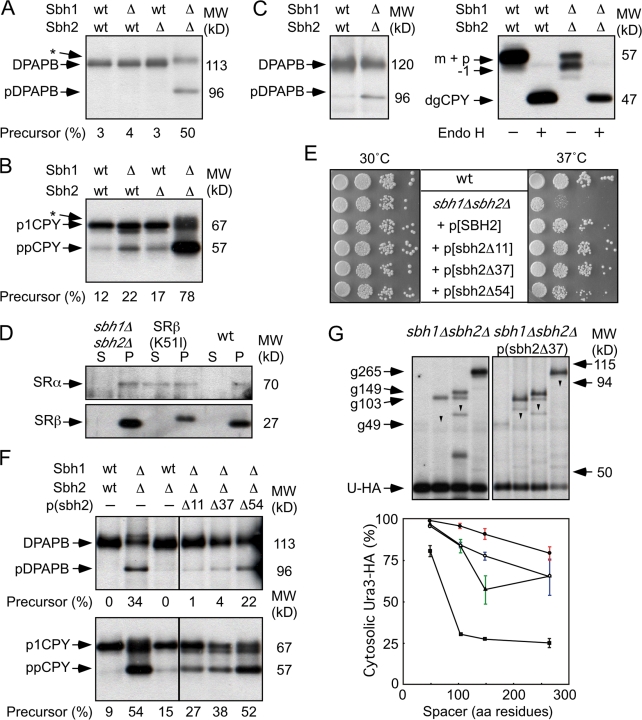
Figure 5.
Translocation defects in sbh1Δsbh2Δ mutants. (A and B) The integration of DPAPB (A) and translocation of CPY (B) were evaluated by 7-min pulse labeling of wild-type (wt) and mutant yeast strains (sbh1Δ, sbh2Δ, and sbh1Δsbh2Δ) after 4 h of growth in SD media at 30°C. The glycosylated (DPAPB) and nonglycosylated (pDPAPB) forms of DPAPB and the ER (p1CPY) and precursor (ppCPY) forms of CPY are labeled. Asterisks designate incompletely glucose-trimmed forms of glycosylated DPAPB and p1CPY. (C) Protein immunoblot detection of DPAPB-HA or CPY in wild-type and sbh1Δsbh2Δ strains. Total cell extracts were prepared for SDS-PAGE with or without prior digestion by endoglycosidase H (Endo H). Precursor and mature forms of DPAPB-HA are labeled. Deglycosylated mature CPY (dgCPY) is resolved from vacuolar CPY (m), preproCPY (p), and a hypoglycosylated form of mCPY (−1). (D) Differential centrifugation of spheroplast lysates prepared from sbh1Δsbh2Δ, srp102(K51I), and wild-type yeast strains. Supernatant (S) and pellet (P) fractions were obtained after centrifugation at 100 Kg. SRα and SRβ were detected using antisera raised against yeast SR. (E–G) Plasmids encoding full-length or N-terminal deletion alleles of Sbh2 were transformed into the sbh1Δsbh2Δ strain. (E) Growth rates of wild-type and mutant strains were compared by serial dilution analysis as described in Fig. 1. (F) Integration of DPAPB and translocation of CPY were evaluated after 24 h of growth in SD media. (G) In vivo cleavage of Dap2 reporters after 24 h of growth in SD media. Labels designate the intact glycosylated (e.g., g265), intact nonglycosylated (arrowheads), and cleaved (Ura3-HA) reporter domains. Spacer length dependence of Dap2 reporter cleavage in wild type (squares), SRα null (triangles), sbh1Δsbh2Δ (closed circles), and the sbh1Δsbh2Δ mutant expressing sbh2Δ37 (open circles). Data points are means of two experiments, one of which is shown above the graph. Data for the wild-type strain is taken from Fig. 3 D. Color-coded error bars designate individual data points for experiments that were performed twice.

