Figure 3.
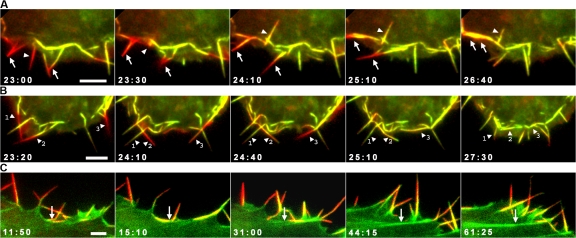
Entry of filopodia into ventral layer of the cytoskeleton. (A and B) Simultaneous wide-field (red) and TIRF (green) microscopy of a cell expressing EGFP-fascin. Filopodia fold down into the zone of the evanescent wave to within 200 nm from the substrate. (A) Filopodium marked with arrowhead folds upwards and then backward into the cell; filopodia marked with arrows fold laterally and down into the cell edge. (B) The numbered filopodia fold in opposite directions into the cell edge. See Video 4 (available at http://www.jcb.org/cgi/content/full/jcb.200709134/DC1). (C) Periphery of a cell transfected with EGFP-fascin (pseudocolor red) and mCherry-actin (pseudocolor green) imaged simultaneously by TIRF microscopy. Note the generation of a ventral stress fiber bundle (arrow) from filopodia that fold bilaterally into the cell edge. Times are given in minutes and seconds. Bars, 5 μm.

