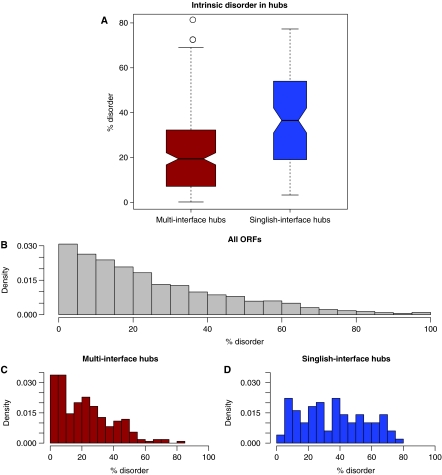
Figure 1.
(A) Disorder in singlish-interface hubs versus multi-interface hubs. (Wilcoxon ranksum test, P=1.0e−8). (B) Distribution of disordered residues in the yeast proteins. As can be seen, most yeast proteins have a relatively low level of disorder; however, almost all have some fraction of disordered residues. (C) Distribution of disorder in multi-interface hubs. The distribution does not significantly deviate from the distribution of the yeast proteome (Kolmogorov-Smirnov test, P-value=0.11). In other words, multi-interface hubs do not have different levels of disorder than normal proteins. (D) Distribution of disorder in singlish-interface hubs. Singlish-interface hubs show a different distribution in terms of disorder (Kolmogorov–Smirnov test, P=2.0e−6).

