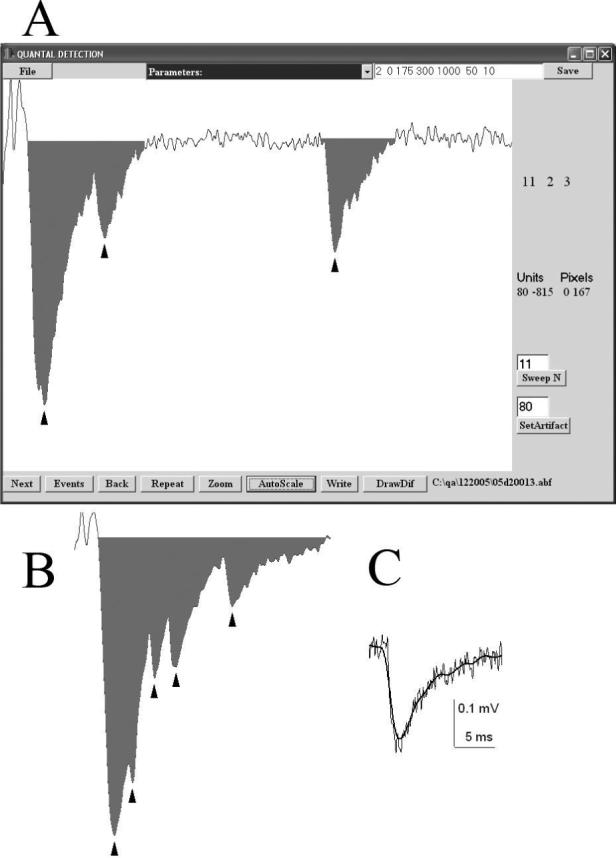
3. Visual quantal detection.

A. A dialog window for the visual quantal detection. The recorded episode is displayed, the EPSC area is marked, arrowheads point to the detected events. Detection parameters are displayed in the top right corner, and they can be edited and saved. A user can inspect all the sweeps in succession (“Next” button), only non-failure sweeps (“Events” button), or enter a sweep number (“Sweep N” button). A click on a screen displays the corresponding time-point and the value of the signal (Units). B. An example of multiple quantal peaks (arrowheads) detected in a single EPSC recorded from the mouse neuromuscular junction (extracellular Ca2+ was reduced to 0.5 mM, stimulation frequency was 15 Hz). C. Gaussian filtering does not change the shape of the signal while reducing the noise. Thin line – recorded signal; thick line – the same signal after filtering with 1/fc=75 time points at the digital resolution of 50 μs.
