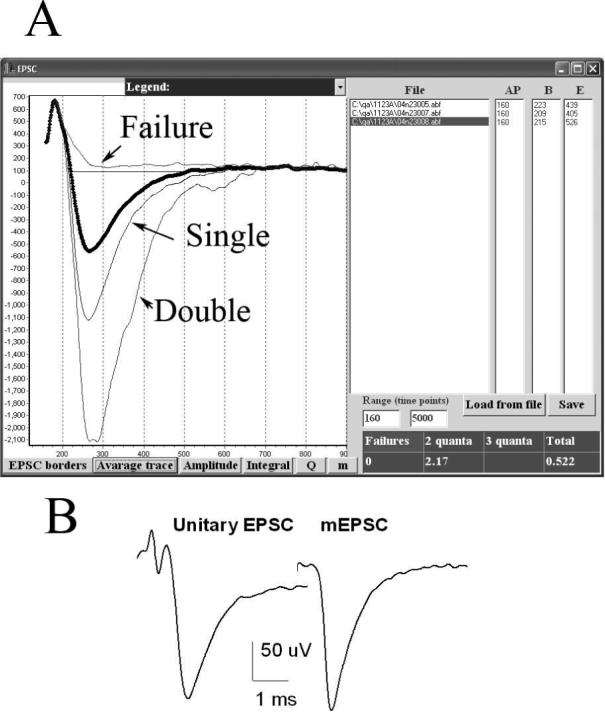
4. Average quantal and multiquantal EPSCs.

A. A dialog window for the visualization of the average quantal and multiquantal EPSCs. The list of the files analyzed appears in the “File” window. The onset and the end points of the average EPSCs are determined in response to the “EPSC borders” button, and, thus, the time window for synchronous release is defined. The latencies of the action potential, the onset, and the end of the average EPSC appear in the windows “AP”, “B”, and “E”, respectively. These values can be edited and saved by a user (“Save” button). The graph (appears in response to “Average trace” button) shows the average single and double EPSCs (thin lines, color coded), as well as the average of all the EPSCs in a highlighted file (thick dotted line). The table (right bottom corner) shows the ratios of the sizes (integrated traces) of multiple EPSCs to the size of the unitary EPSC. In this experiment, EPSCs were recorded from the mouse nmj at 15 Hz stimulation frequency at the reduced (0.5 mM) extracellular Ca2+. The area of the average double EPSC was 2.17 times larger than the average area of the unitary EPSC; triple quantal EPSCs were not detected; the average failure ran above the baseline, its size being equal 0. Thus, in this example quantal detection could be considered accurate, since the EPSCs detected as doubles are approximately twice (2.17 times) larger than the EPSCs detected as unitary. The ratio of the area of the average EPSC to the unitary EPSC (0.522) can be considered a reasonable estimate of m. The amplitudes and the areas of the average EPSCs can be plotted in this window and saved in the *.pfl file (“Amplitude” and “Integral” buttons), as well as the amplitudes of the average unitary EPSCs (“Q” button) and the estimates of m (“m” button). B. The average unitary EPSC and the average mEPSC obtained from the same dataset are similar, which confirms that that multiple quantal EPSCs were not classified as single quanta. Note that the average mEPSC has a slightly larger amplitude than the average unitary EPSC, and it is slightly sharper. The reason is that mEPSCs were superimposed according to their peak latencies, while EPSCs were always superimposed according to the action potential latencies, thus some asynchrony of synaptic latencies was present in the superposition of unitary EPSCs.
