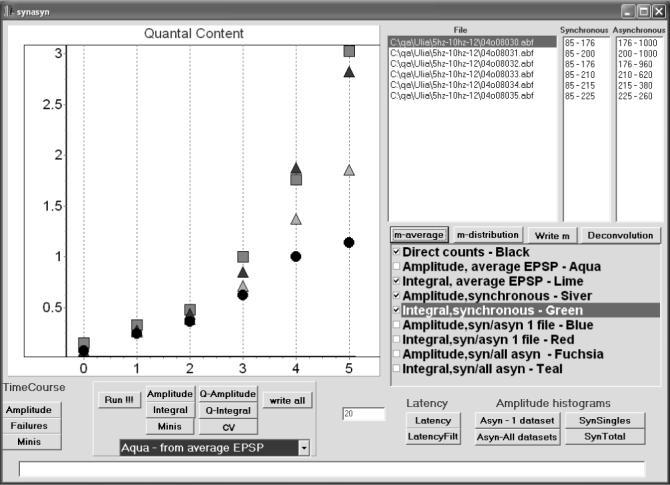
5. Evaluation of quantal content m.

In this experiment, EPSCs (300 sweeps per file) were recorded from the lobster nmj at stimulation frequencies of 5, 10, 20, 30, 40, and 50 Hz (points 0−5). Quantal content was evaluated by four methods (checked): direct counts (circles); the average EPSC amplitude divided by the average amplitude of the unitary EPSC from the highlighted file (light triangles); the average EPSC area divided by the average area of the unitary EPSC from the highlighted file (dark triangles); the area of the average superimosed EPSC divided by the area of the average superimposed unitary EPSC from the highlighted file (squares). At the points 0−2 (5−20 Hz stimulation frequency) the results of all the methods agree, thus direct counts can be considered accurate. At the points 3−5 (30−50 Hz) the area measurements (squares and dark triangles) give the highest quantal content. Since these two m estimates obtained by area measurements are in a good agreement, area measurements can be considered accurate. In contrast, amplitude measurements (light triangles) and direct counts (circles) underestimate quantal content at high stimulation frequencies (30−50 Hz, points 3−5). Other methods available for m evaluation (listed) are: 1) the amplitude of the average superimposed EPSC divided by the amplitude of the average superimposed unitary EPSC in the highlighted file; 2) the average EPSC amplitude or area divided by the average amplitude or area of mEPSCs collected from either the highlighted file or throughout the experiment.
