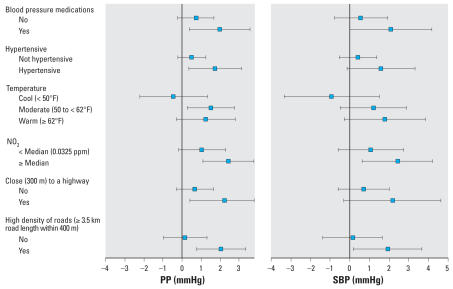
Figure 1.
Stratified estimates (95% CIs) of the difference in PP and SBP per 10-μg/m3 increase in PM2.5 prior 30-day average, adjusted for model 2 covariates (except the stratification by temperature, which was adjusted for model 1 covariates). All tests for interactions were p < 0.09 except for Close to a highway: p < 0.3 for SBP.

