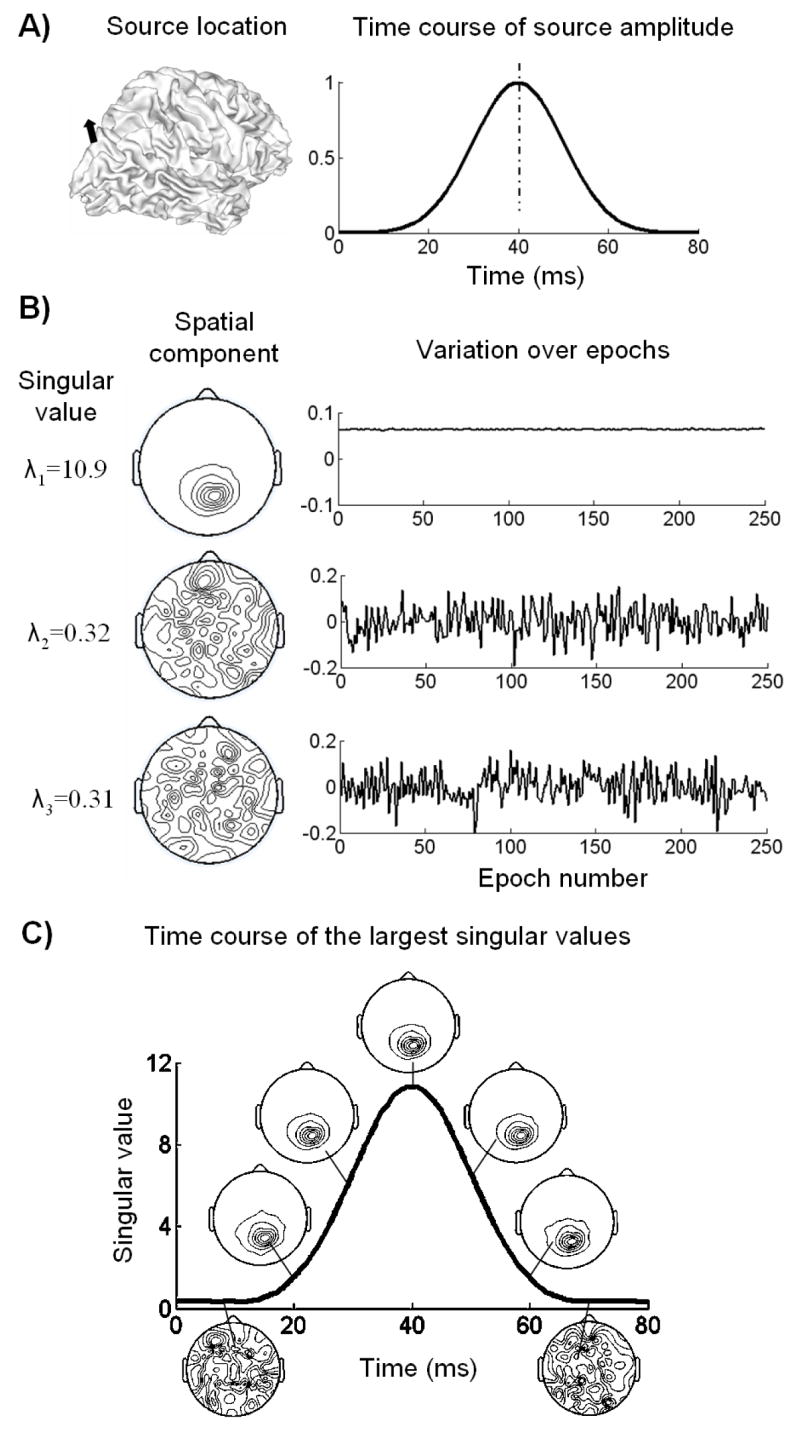
Figure 5.

An example of the SVD analysis on the segmented epochs. A) The EEG data was simulated from a single source activity, with the source location on the cortex shown on the left and the source waveform shown on the right; B) the largest 3 SVD components of the data at the peak latency (40 ms) over all the epochs. The singular values are shown in the left column, the decomposed spatial components shown in the middle and the corresponding variations over epochs shown in the right; C) the plot of the largest singular value as a function of time; the spatial components associated with the largest singular value at 7 representative time points are displayed along the plotted time course.
