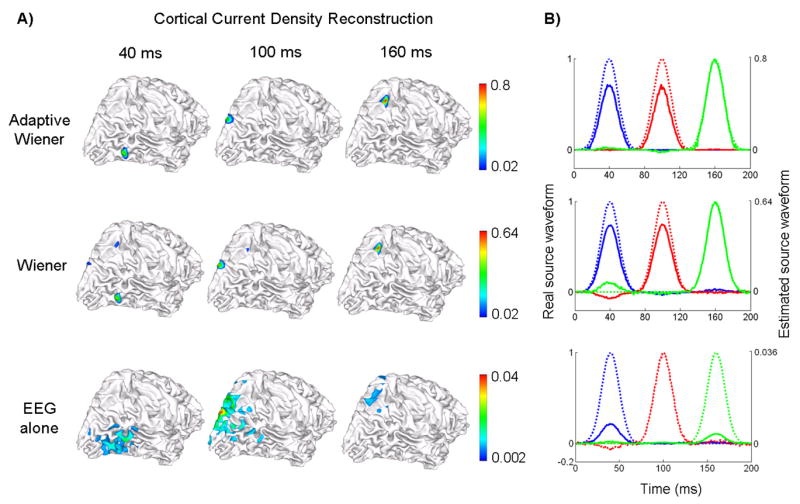
Figure 7.

Source distribution reconstruction and source waveform estimation under fMRI false positives. The source locations and simulated source waveforms are the same as used in Fig. 6. A) Reconstructed cortical current density distribution at 3 peak latencies (40, 100 and 160 ms) shown in 3 columns, by using 3 different algorithms: the adaptive Wiener filter (1st row), the conventional Wiener filter using time-invariant spatial constraints (2nd row) and the weighted minimum norm based on the EEG alone (3rd row); B) Estimated source waveforms at each of 3 source locations color-coded as in Fig. 6. The estimated waveforms are shown in solid lines and the simulated original waveforms are shown in dashed lines. The 3 rows also correspond to 3 algorithms as in Fig. 7.A).
