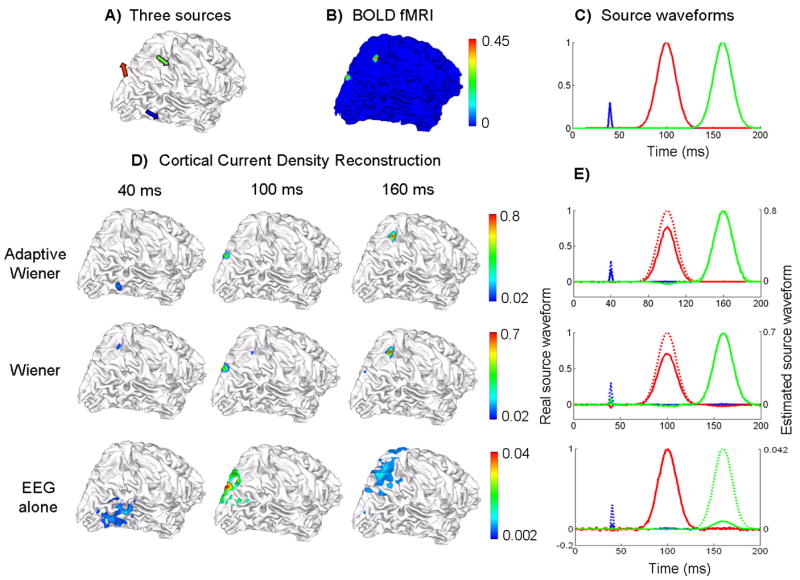
Figure 8.

Source distribution reconstruction and source waveform estimation under fMRI false negatives. A) 3 source locations, B) quantified BOLD fMRI map, C) the simulated source waveforms, D) Reconstructed cortical current density distribution at 3 peak latencies (40, 100 and 160 ms) shown in 3 columns, by using 3 different algorithms: the adaptive Wiener filter (1st row), the conventional Wiener filter using time-invariant spatial constraints (2nd row) and the weighted minimum norm based on the EEG alone (3rd row); E) Estimated source waveforms at each of 3 source locations color-coded as in Fig. 8.C). The estimated waveforms are shown in solid lines and the simulated original waveforms are shown in dashed lines. The 3 rows also correspond to 3 algorithms as in Fig. 8.D).
