
Figure 9.
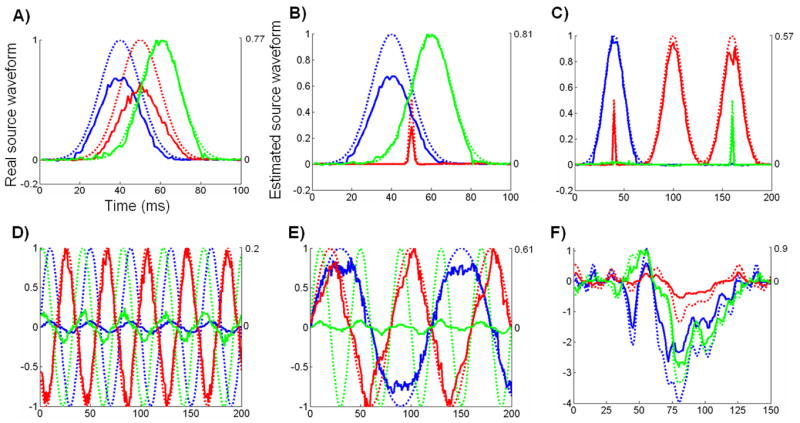
Estimated source waveforms compared to the real source waveforms with different temporal features. 3 sources locations are the same as in Fig. 8. The originally simulated waveforms are shown in dashed lines and the estimated source waveforms are shown in solid lines.