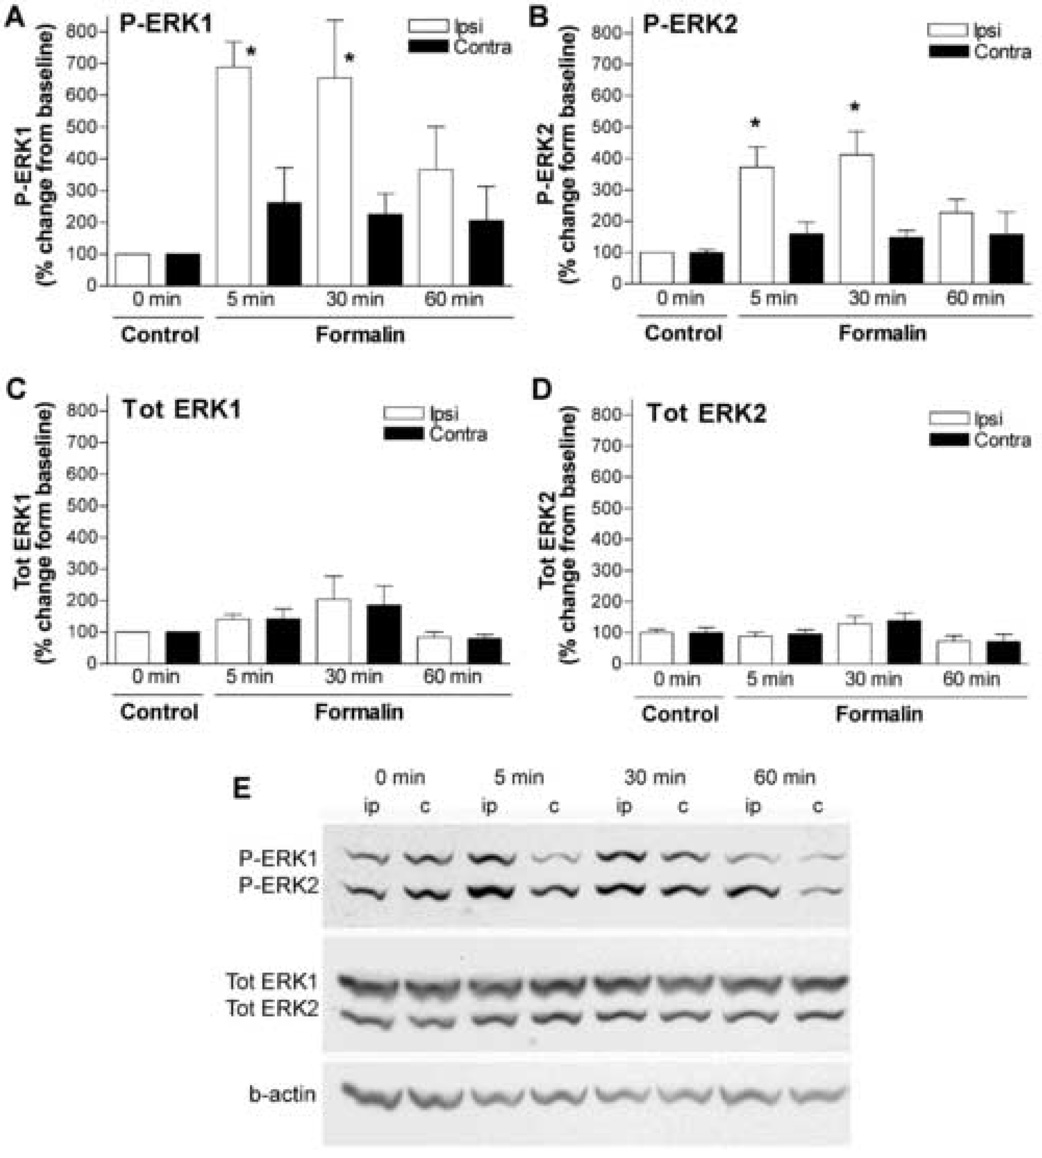
Figure 1.
Injection of formalin to the paw activates ERK1/2 in the spinal cord. Percentage change of phosphorylated (P) ERK1 (A), P-ERK2 (B), Total (Tot) ERK1 (C) and Tot-ERK2 (D) in the lumbar dorsal cord ipsilateral (ipsi) or contralateral (contra) to formalin paw injection at 5, 30 and 60 min compared to naïve control. The data were normalized against beta-actin (b-actin) expressed in each sample. N=4–7/group, *p < 0.05, 5 or 30 min vs. 0 min, one-way ANOVA. (E) Representative western blots showing the levels of P-ERK1/2, tot ERK1/2 and b-actin in ipsilateral (ip) and contraleteral (c) spinal cords after formalin injections at the time points of 5, 30 and 60 min (0 min = naïve rat).

