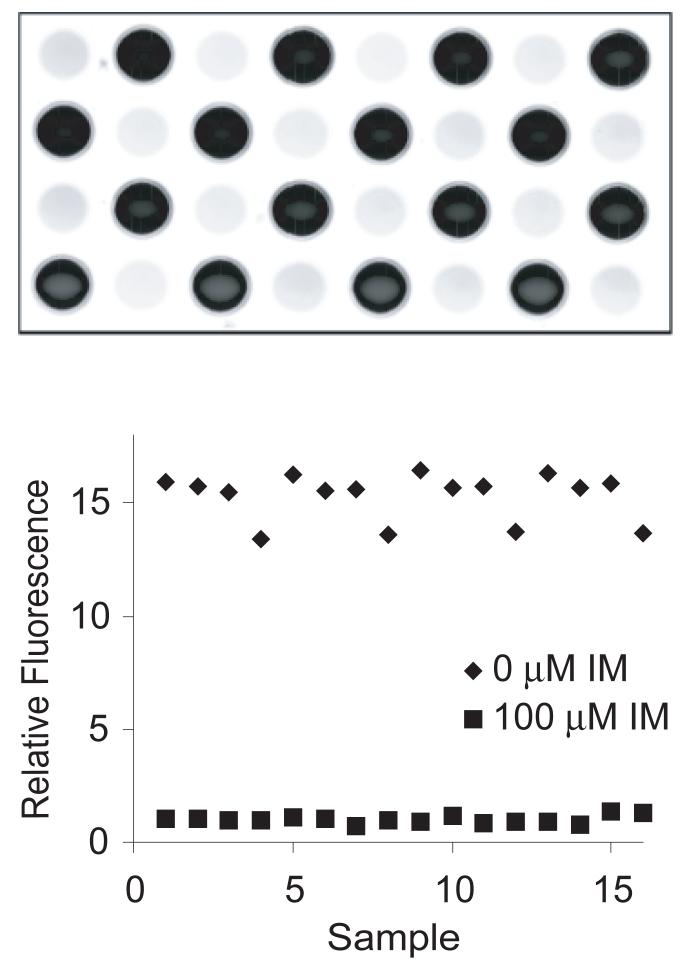
Fig. 4.
Evaluation of well-to-well consistency within the assay. (A) The kinase assay was performed using the standard assay conditions with or without 100 μM imatinib as negative and positive controls. (B) Plot of fluorescence intensity of wells after 30 min incubation with Amplex Red. Relative intensity was determined by dividing total well fluorescence by the mean intensity of the wells containing 100 μM imatinib. The signal to background, signal to noise, and Z-factor were calculated as described in Materials and Methods.

