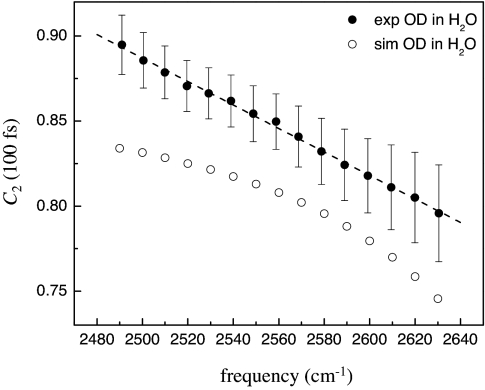
Fig. 2.
Amplitudes of the experimentally measured orientational correlation functions at t = 100 fs as a function of the OD stretching frequency (hydrogen bond strength, solid circles). The dashed line is a linear fit to the data. Also, the amplitudes of the orientational correlation function from MD simulations (open circles) are shown.

