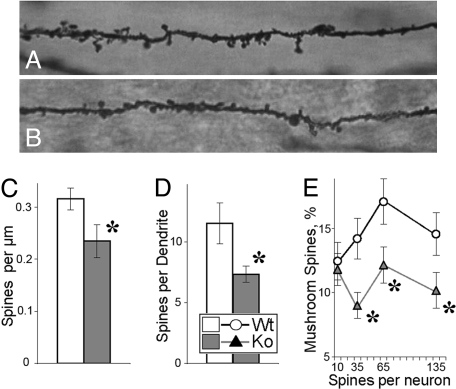
Fig. 4.
Fine structure of CA1 dendrites in the hippocampus of BACE1−/− mice. (A and B) Representative images of dendrites from CA1 pyramidal neurons of WT (A) and BACE1−/− mice (B). (C) Spine density (per millimole) for WT and BACE1−/− neurons (n = 241 and 182, respectively). (D) Total spine number per dendrite (n = 909 and 658 dendrites for WT and BACE1−/−, respectively). (E) Proportions of mushroom-shaped spines (from a total pool of 10,637 and 4,648 spines for WT and BACE1−/−, respectively) were calculated for each neuron and are shown as function of neurons with different spine load. Asterisks indicate significant differences between WT and BACE1−/− measures (P < 0.05) as a result of ANOVA (C and D) or post hoc tests applied to a significant effect of ANOVA (E).

