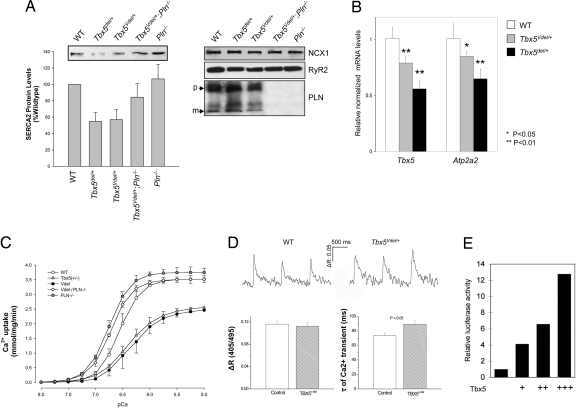
Fig. 2.
Tbx5 modulates SERCA2 expression. (A) Western blots showing decreased levels of SERCA2 protein in Tbx5del/+ and Tbx5Vdel/+ ventricular extracts. Normal levels of Ncx1, RyR2, and PLN were found in all genotypes. (B) Quantitative RT-PCR demonstrating decreased Tbx5 and Atp2a2 mRNA levels in Tbx5del/+ and Tbx5Vdel/+ ventricular extracts (n = 6 for each genotype; means ± SEMs are shown). *, P < 0.05; **, P < 0.01. (C) Ca2+ uptake in ventricular tissues demonstrating impaired Ca2+ uptake in Tbx5del/+ and Tbx5Vdel/+ mice and restoration to WT levels in Tbx5Vdel/+;PLN−/− mice. (D) Intracellular Ca2+ transients. (Upper) Representative Ca2+ transient recordings obtained from control and Tbx5Vdel/+ cardiomyocytes under field stimulation at 1 Hz (35.5 ± 0.5°C) and loaded with indo 1-AM. ΔR stands forΔR405/495, the ratio of the intensity of fluorescence emitted at 405 nm to that at 495 nm, which is used as an index of intracellular Ca2+ concentrations in this study. (Lower) Mean data of Ca2+-transient amplitude (ΔR405/495) and time constant (τ) of Ca2+ transient decay (in milliseconds) obtained from myocytes isolated from control (n = 41 cells) and Tbx5Vdel/+ (n = 43 cells) mice. (E) Luciferase reporter assay shows dosage-dependent activation of Atp2a2-luciferase. Expression vectors: +, 100 ng; ++, 250 ng; +++, 500 ng.

