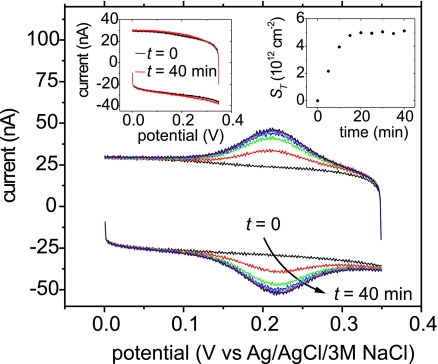
Fig. 1.
CV time series showing progress of hybridization to complementary target at 5 min intervals from 0 to 40 min. (Right Inset) Target coverage as a function of time. (Left Inset) Initial (t = 0) and final (t = 40 min) CV traces for a noncomplementary 5′-TTT TTT TCC TTC CTT TTT-F2–3′ ferrocene-labeled target. Probe coverage, 5.7 × 1012 cm−2; buffer strength, 1 M; target concentration, 100 nM.

