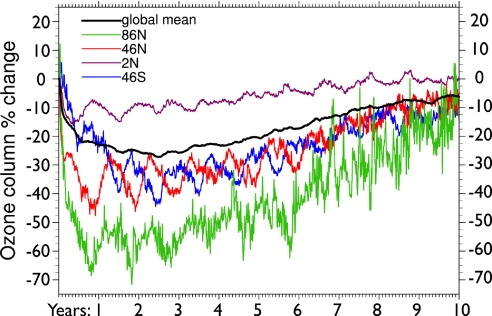
Fig. 1.
Time evolution of the total ozone column after a 5-Tg soot injection in the upper troposphere at 30°N latitude. Changes in ozone are given as a percent deviation of the integrated column from the control run, or baseline value, as a function of time since soot injection. The global-mean total ozone variation is shown along with zonal-average changes at four specific latitudes (as labeled). Note that the seasonal signal is amplified during periods of strong smoke perturbation, especially at midlatitudes.

