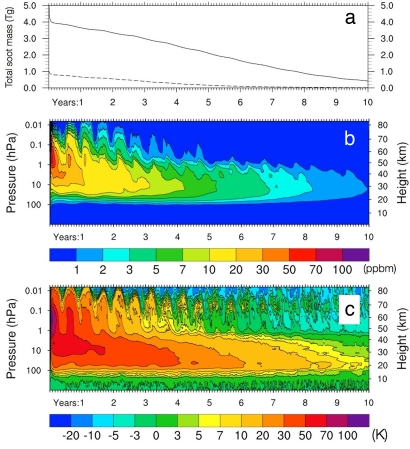
Fig. 5.
Global mean time evolution of soot mass and temperature. (a) Time evolution of the total mass of atmospheric soot (Tg) after the injection of 5 Tg (solid line) and 1 Tg (dashed line) into the upper troposphere, with radiative feedback. (b) Time evolution of the vertical profile of calculated soot global mean mass mixing ratio (ppbm, 10−9 kg/kg of air) after the injection of 5 Tg of soot into the upper troposphere, with radiative feedback. (c) Time evolution of the vertical profile of the change in global average temperature (°C) due to the 5-Tg soot injection (soot-control).

