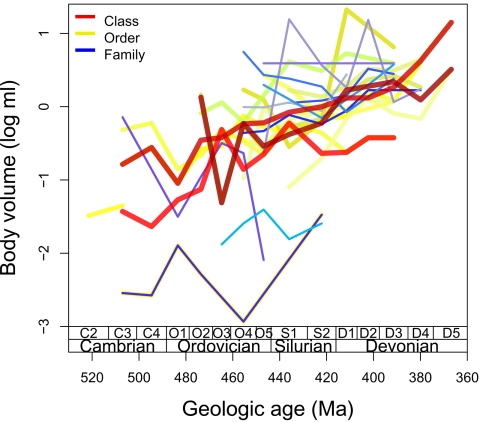
Fig. 2.
Mean size trends among brachiopod clades (classes, orders, and families). Different clades are distinguished by different shades of color, with line width corresponding to level of hierarchical nestedness. Large clades display parallel trends of increasing size (i.e., classes parallel other classes, orders parallel other orders), whereas trends within small, constituent clades (families) display more stochastic dynamics. Only clades with a minimum of 10 occurrences over five intervals are colored, except for the addition of order Paterinida, included to allow additional documentation of Cambrian trends, and the omission of class Craniata, which suffers from inconsistent sampling. The greenish trend represents the overlaying of a thick yellow order trend and a thin blue family trend because order Acrotretida here includes a single family. See SI Appendix, Fig. 6 for identities of these and additional taxa. SE bars are comparable in magnitude to those for the Brachiopoda as a whole, as shown in Fig. 1. Time scale details also are as in Fig. 1. Ma, megaannum (millions of years ago).

