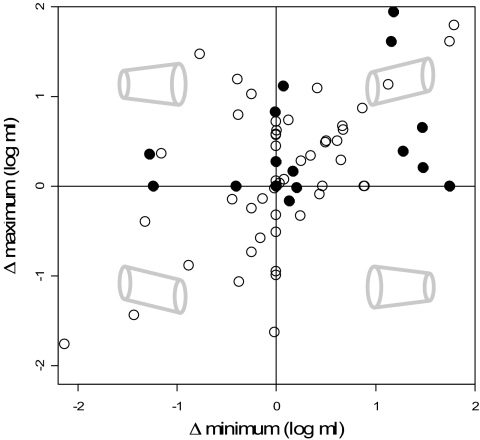
Fig. 4.
Net behavior of minimum and maximum size transitions within individual brachiopod orders (filled circles, n = 17) and families (open circles, n = 86). Axes note the change in the minimum (on abscissa) and maximum sizes, measured in log10 ml, from oldest to youngest occurrences in each taxon (10); this overall behavior is portrayed by gray images, with time progressing to the right. For example, the upper right quadrant (quadrant 1) represents increases in the minimum and maximum (i.e., Cope's rule), while the upper left quadrant (quadrant 2) represents an increase in the overall size range (i.e., increased variance) caused by increasing maximum and decreasing minimum sizes. Several points overlap on origin (values provided in SI Appendix, Table 4).

