
Figure 1.
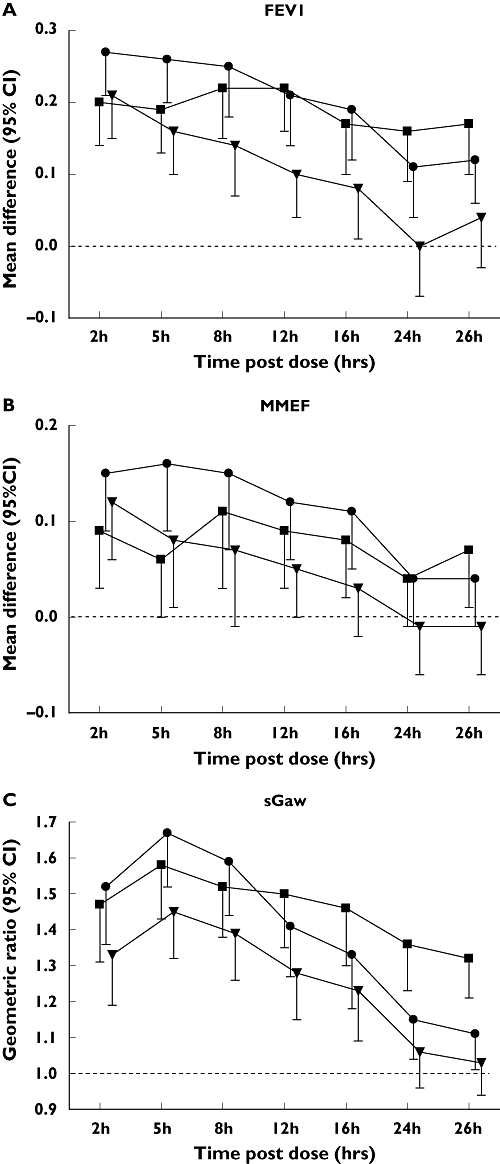
Active treatment vs. placebo (P) comparisons for (A) forced expiratory volume in 1 s (FEV1), (B) maximum mid-expiratory flow (MMEF) and (C) specific airway conductance (sGaw). Data for FEV1 and MMEF are mean difference [95% confidence intervals(CI)], data for sGaw are geometric mean ratio (one-sided 95% CIs shown). Tio vs P, (▪); S100 vs P, (•); S50 vs P, (▾)