
Figure 2.
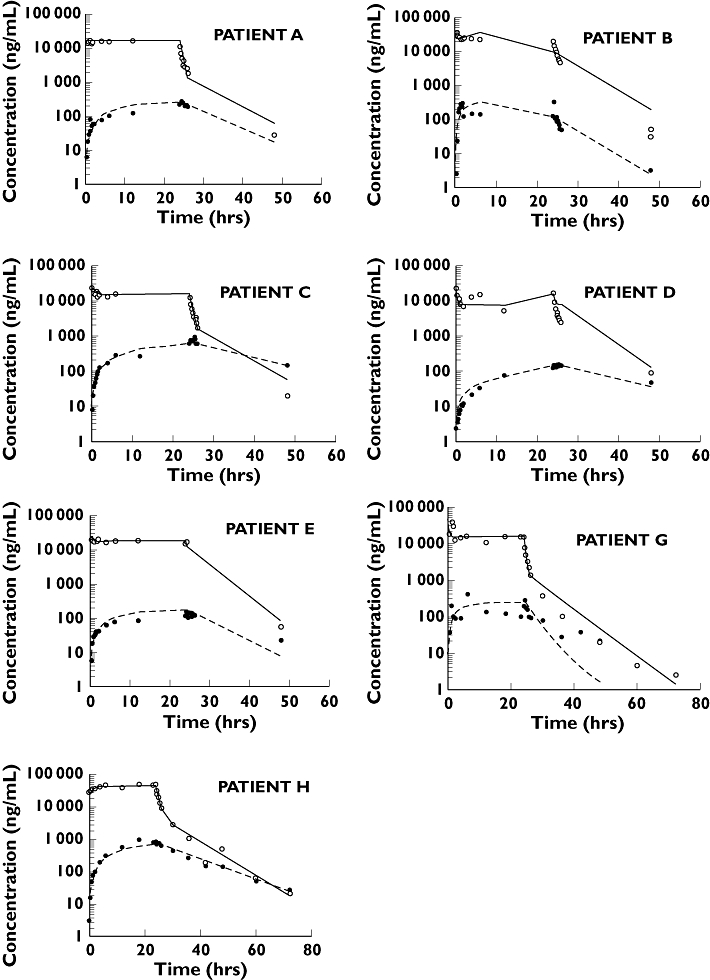
Predicted plasma and CSF concentrations, assuming the model given in Figure 1. Open and closed circles are plasma and CSF data, respectively; solid and dotted black lines are the individual predictions for plasma and CSF concentrations
Official websites use .gov
A
.gov website belongs to an official
government organization in the United States.
Secure .gov websites use HTTPS
A lock (
) or https:// means you've safely
connected to the .gov website. Share sensitive
information only on official, secure websites.
Predicted plasma and CSF concentrations, assuming the model given in Figure 1. Open and closed circles are plasma and CSF data, respectively; solid and dotted black lines are the individual predictions for plasma and CSF concentrations