
Figure 2.
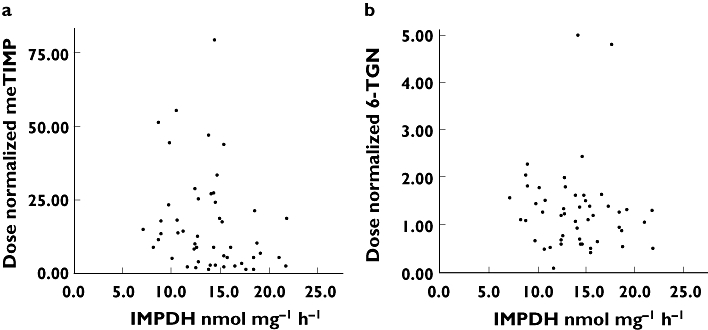
Inflammatory bowel disease patients, n = 50. (a) A scatterplot of inosine-5′-monophosphate dehydrogenase (IMPDH) activity and 6-methylthioinosine 5′-monophosphate concentrations normalized to azathioprine dose (rs = −0.31, P = 0.03). (b) A scatterplot of IMPDH activity and dose-normalized 6-thioguanine nucleotide concentrations (rs = −0.16, P = 0.27)