
Figure 2.
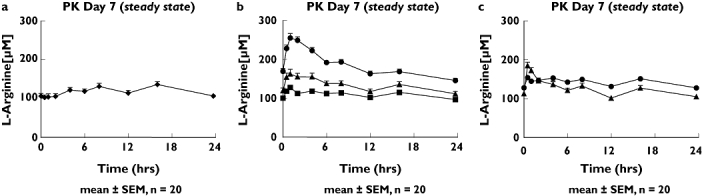
Plasma concentrations of L-arginine at steady state (mean ± SEM, n = 17 for arginine immediate-release (IR) and n = 20 for all others). (A) Placebo (♦) curve. (B) After 1 week of 0.75 (▪), 1.5 (▴) and 3 g (•) twice-daily citrulline supplementation. (C) After 1 week of 1.0 g (▴) tid arginine IR and 1.6 g (•) bid arginine sustained-release supplementation