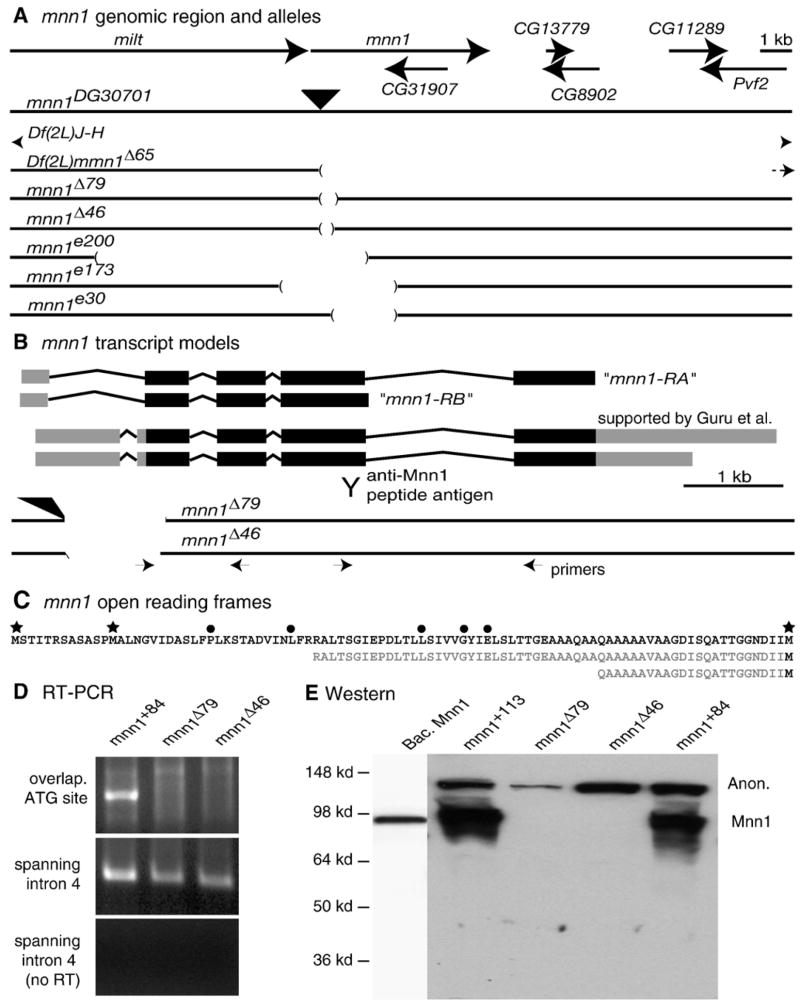
Fig. 2.
Map of mnn1 locus and description of mnn1 alleles. (A) Molecular map of the mnn1 genomic region showing the flanking gene milton (milt) and the CG31907 gene nested in mnn1. Big arrows indicate the 5′ to 3′ orientation of the genes. Genomic maps of mnn1 mutants are reported in scale below. The black filled triangle localizes the P{wHy}30G01 insertion. Gaps in lines indicate the deleted genomic sequences described for each mnn1 mutant allele. (B) Molecular map of the mnn1 transcripts. Filled boxes show exons, thin lines show introns, black filling indicates the open reading frame, gray filling indicates untranslated regions and alternative poly-A. Mnn1-RA and mnn1-RB indicate the long and the short transcript annotated in FlyBase. Y sign indicates the antigenic sequence used to generate anti-Mnn1. Interrupted lines show genomic map of mnn1Δ46 and mnn1Δ79 alleles in scale with the mnn1 transcripts. Small arrows localize the sites and directions of RT-PCR primers. (C) Amino acid sequence of N-terminus of Mnn1 protein. Stars indicate alternative translational start sites. Filled circles indicate amino acid residues mutated in MEN1 patients. Sequences in gray show the amino acid residues missing in mnn1Δ46 and mnn1Δ79 due to the absence of the ATG (D) RT-PCR analysis of RNA extracted from mnn1+84 precise-excision and mnn1Δ46 and mnn1Δ79 mutant strains, using a primer overlapping the ATG sequence (upper panel) or primers spanning intron 4 sequence (middle panel). Control for genomic DNA contamination is shown (lower panel). (E) Western blot anti-Mnn1 on bacterial expressed pure Mnn1 and protein extracts from wild type (mnn1+113 and mnn1+84) and mnn1 mutant (mnn1Δ46 and mnn1Δ79) adult heads. All lanes are from a single blot. Expected mobility of Mnn1 and an anonymous (Anon) cross-reacting material is shown.

