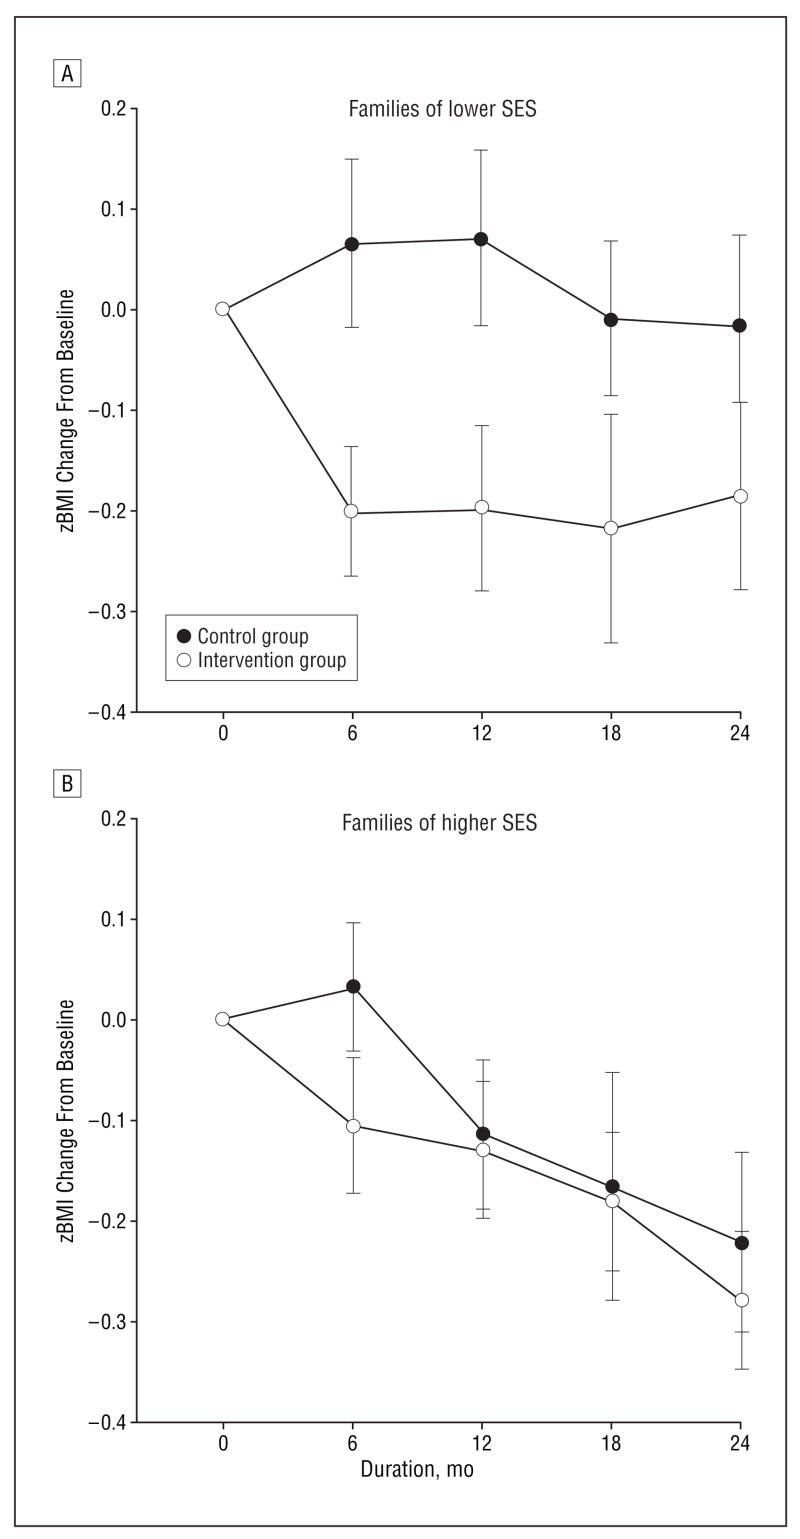
Figure 5.
Change in age- and sex-standardized body mass index (zBMI) values relative to baseline for the intervention and control groups over time. A statistically significant difference in the rate of change in zBMI by group for families divided into lower (A) and higher (B) socioeconomic status (SES) was observed (P = .01). Data are given as mean (SEM).

