
Figure 1.
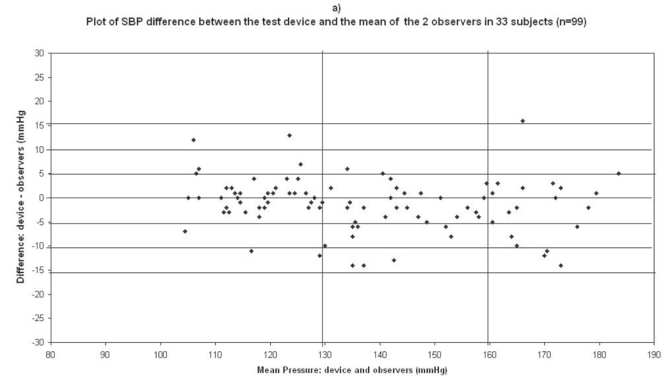
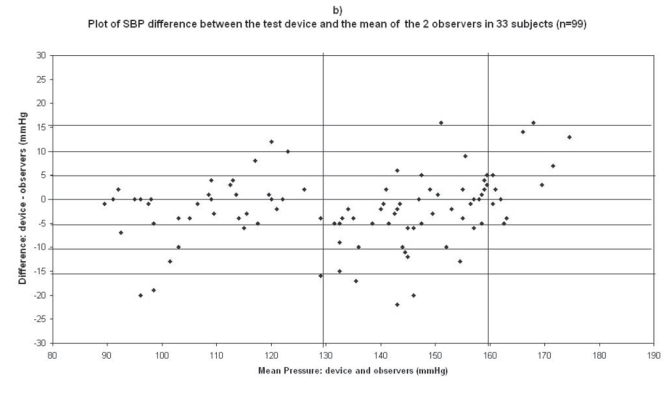
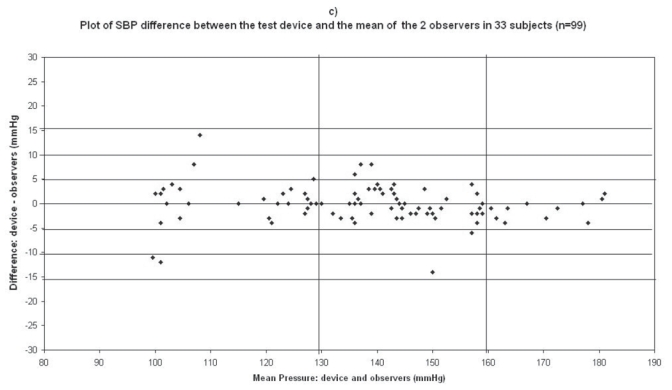
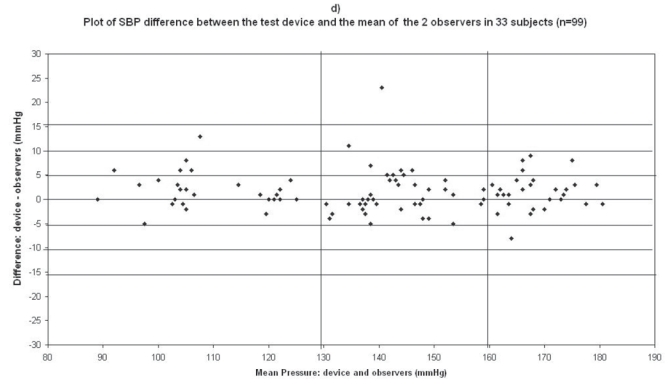
Plots for systolic blood pressure (SBP) difference between the test device readings and the mean of the two observer readings in 33 participants (n = 99) versus the mean of the devices and the mercury sphygmomanometer readings: (a) Omron M1 Plus (HEM 4011C-E), (b) Omron M6 Comfort (HEM-7000-E), (c) Spengler KP7500D, (d) Microlife BP A100 Plus.