
FIGURE 5. Fluorescence titrations of an array of SC-(1–325) ·ProT analog complexes with Fbg.
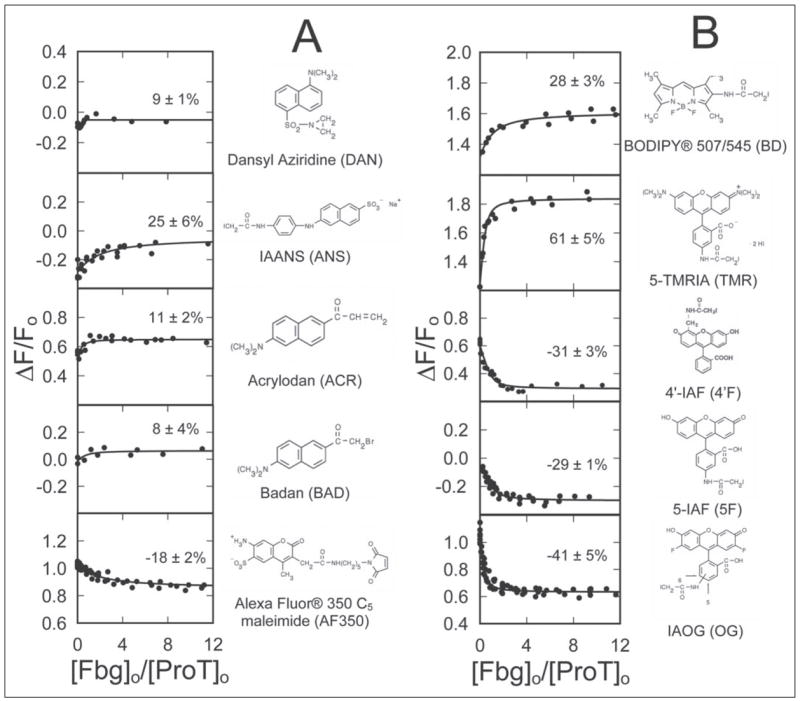
The fractional change in fluorescence (ΔF/Fo) is plotted against the ratio of the total concentrations of Fbg to ProT ([Fbg]o/[ProT]o) for 10 ProT analogs labeled with the indicated thiol-reactive probes. The lines through the data represent the least squares fits of the binding equation with the indicated maximum fluorescence changes (%). Fluorescence titrations were performed and analyzed as described under “Experimental Procedures.”