
FIGURE 2.
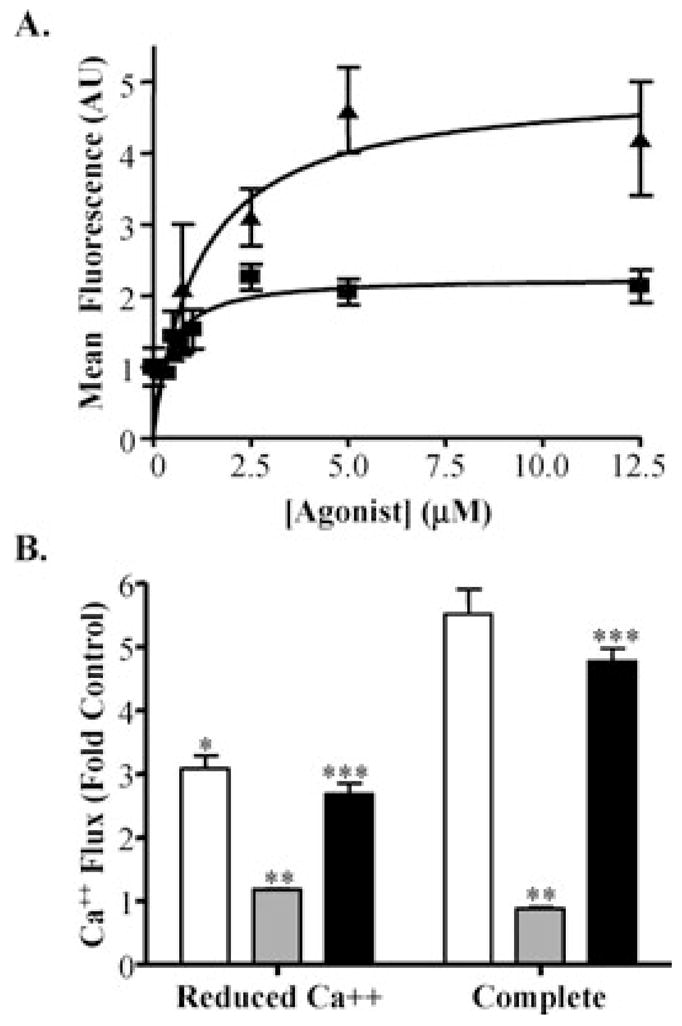
(A) Dose-response data for the induction of intracellular calcium flux in TRPV1-overexpressing cells by RTX (squares) and capsaicin (triangles). Data represent the mean fluorescence values for cell populations and standard deviation (n = 4). EC50 values were obtained by nonlinear regression analysis (Prism 4, GraphPad Software, Inc., San Diego, CA) using the one-site binding model. (B) Attenuated capsaicin-induced (20 μM) calcium flux (open bars) in TRPV1-overexpressing cells using reduced calcium solutions (left group), depletion of ER-calcium stores with thapsigargin (1.5 μM, 5 min) (gray bars), and treating with 100 μM EGTA and 10 μM ruthenium red (black bars). Data represent the mean fluorescence values for cell populations and standard deviation (n = 4). *Statistically significant decreases relative to complete media, **significant decreases due to depletion of ER calcium stores, and ***additional decreases afforded by EGTA and ruthenium red (p ≤ 0.05) are identified.